
01
Streams and messages
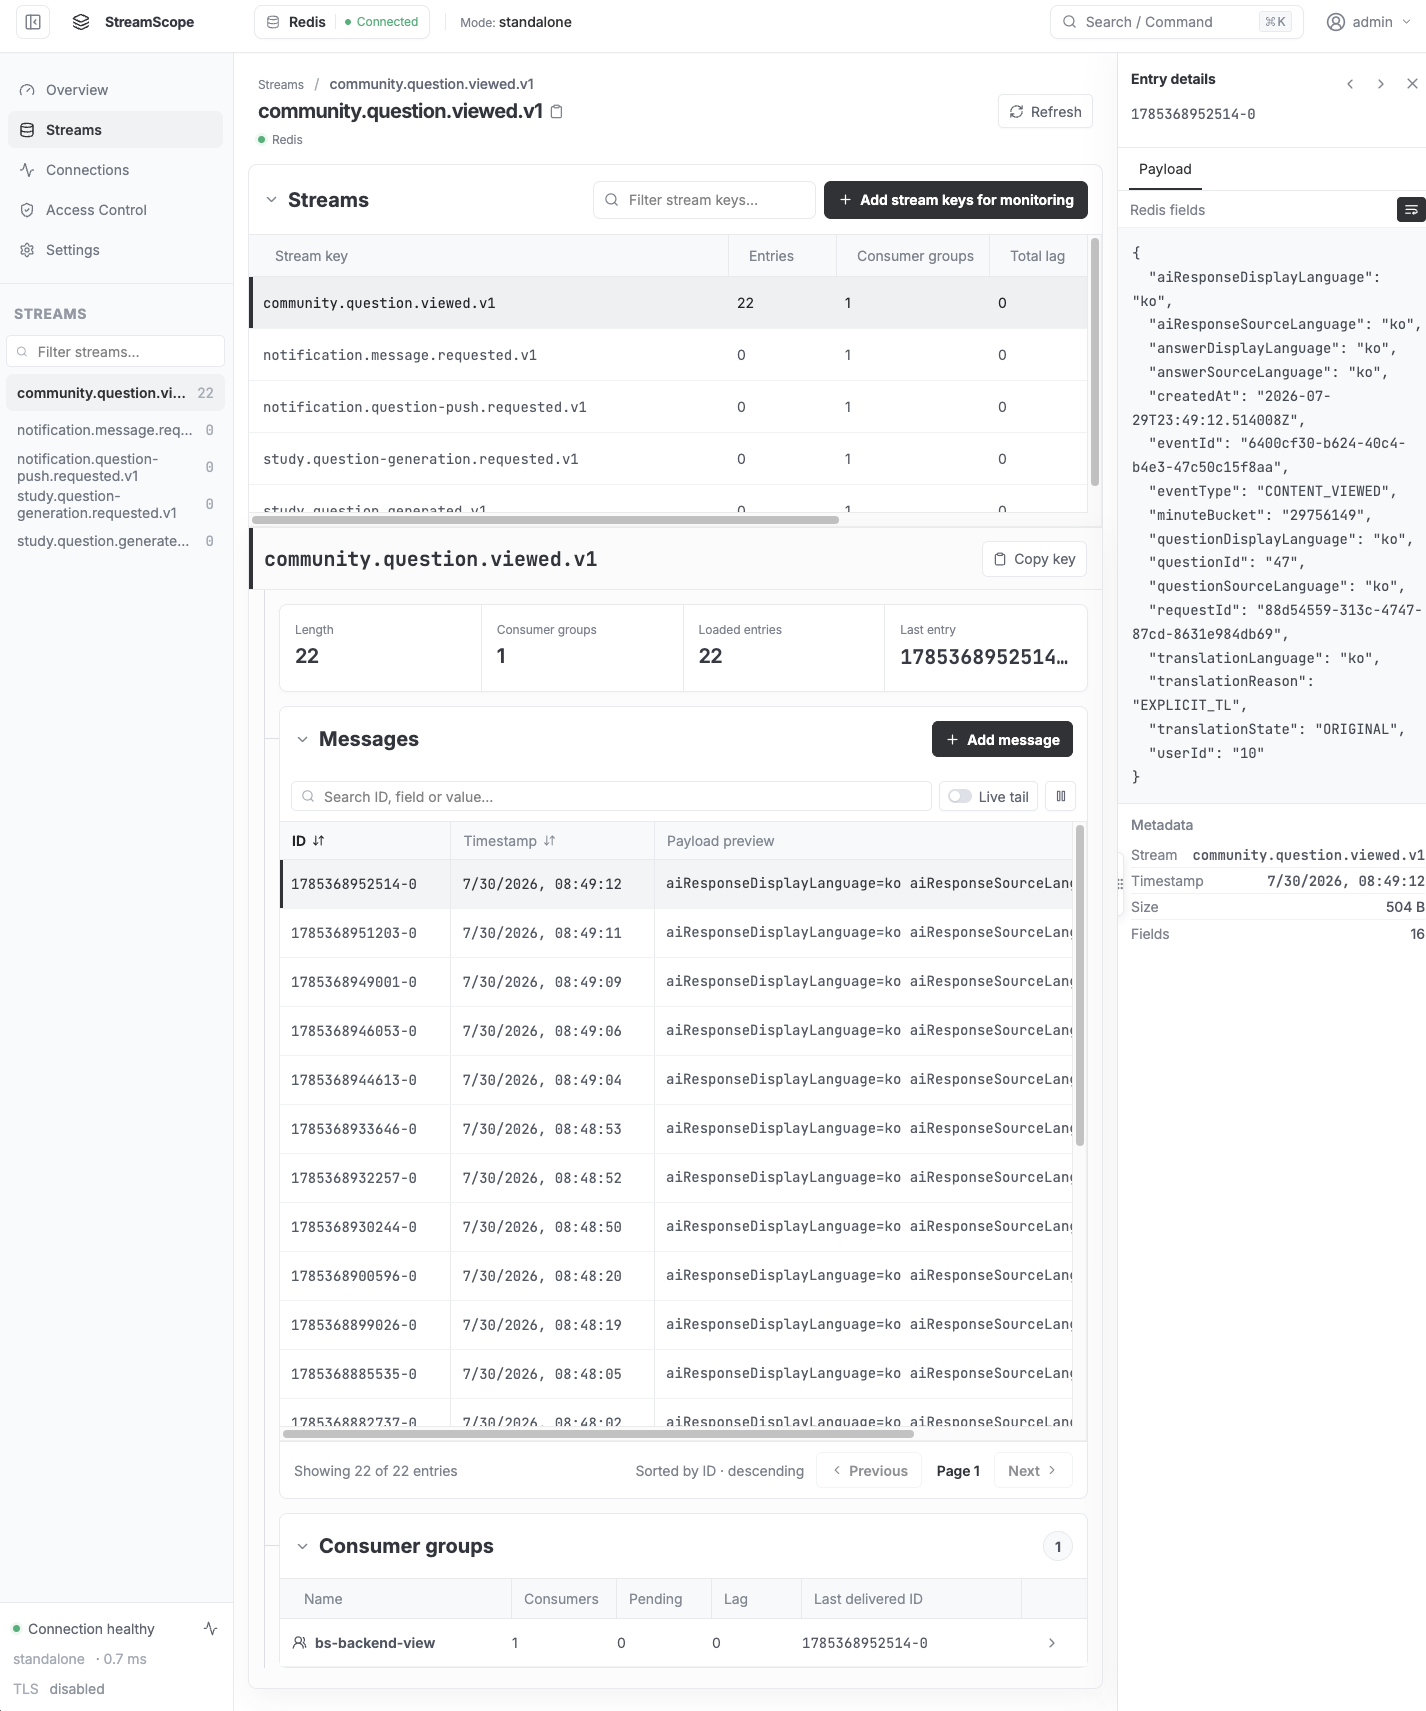
Browse stream metadata, entries, field values, lengths, and MAXLEN settings from a single workspace.
Redis Streams monitoring UI
We could not find a monitoring UI made specifically for Redis Streams, so we built RedisStreamScope. Start it with Docker or Helm, then connect Redis in the browser.
docker run -d \
  --name redisstreamscope \
  -p 8080:8080 \
  -v redisstreamscope-data:/data \
ghcr.io/ghkdqhrbals/redisstreamscope:latestadmin / password
Operations
01
Browse stream metadata, entries, field values, lengths, and MAXLEN settings from a single workspace.
02
Inspect groups, consumers, lag, pending entries, idle time, delivery counts, and ownership.
03
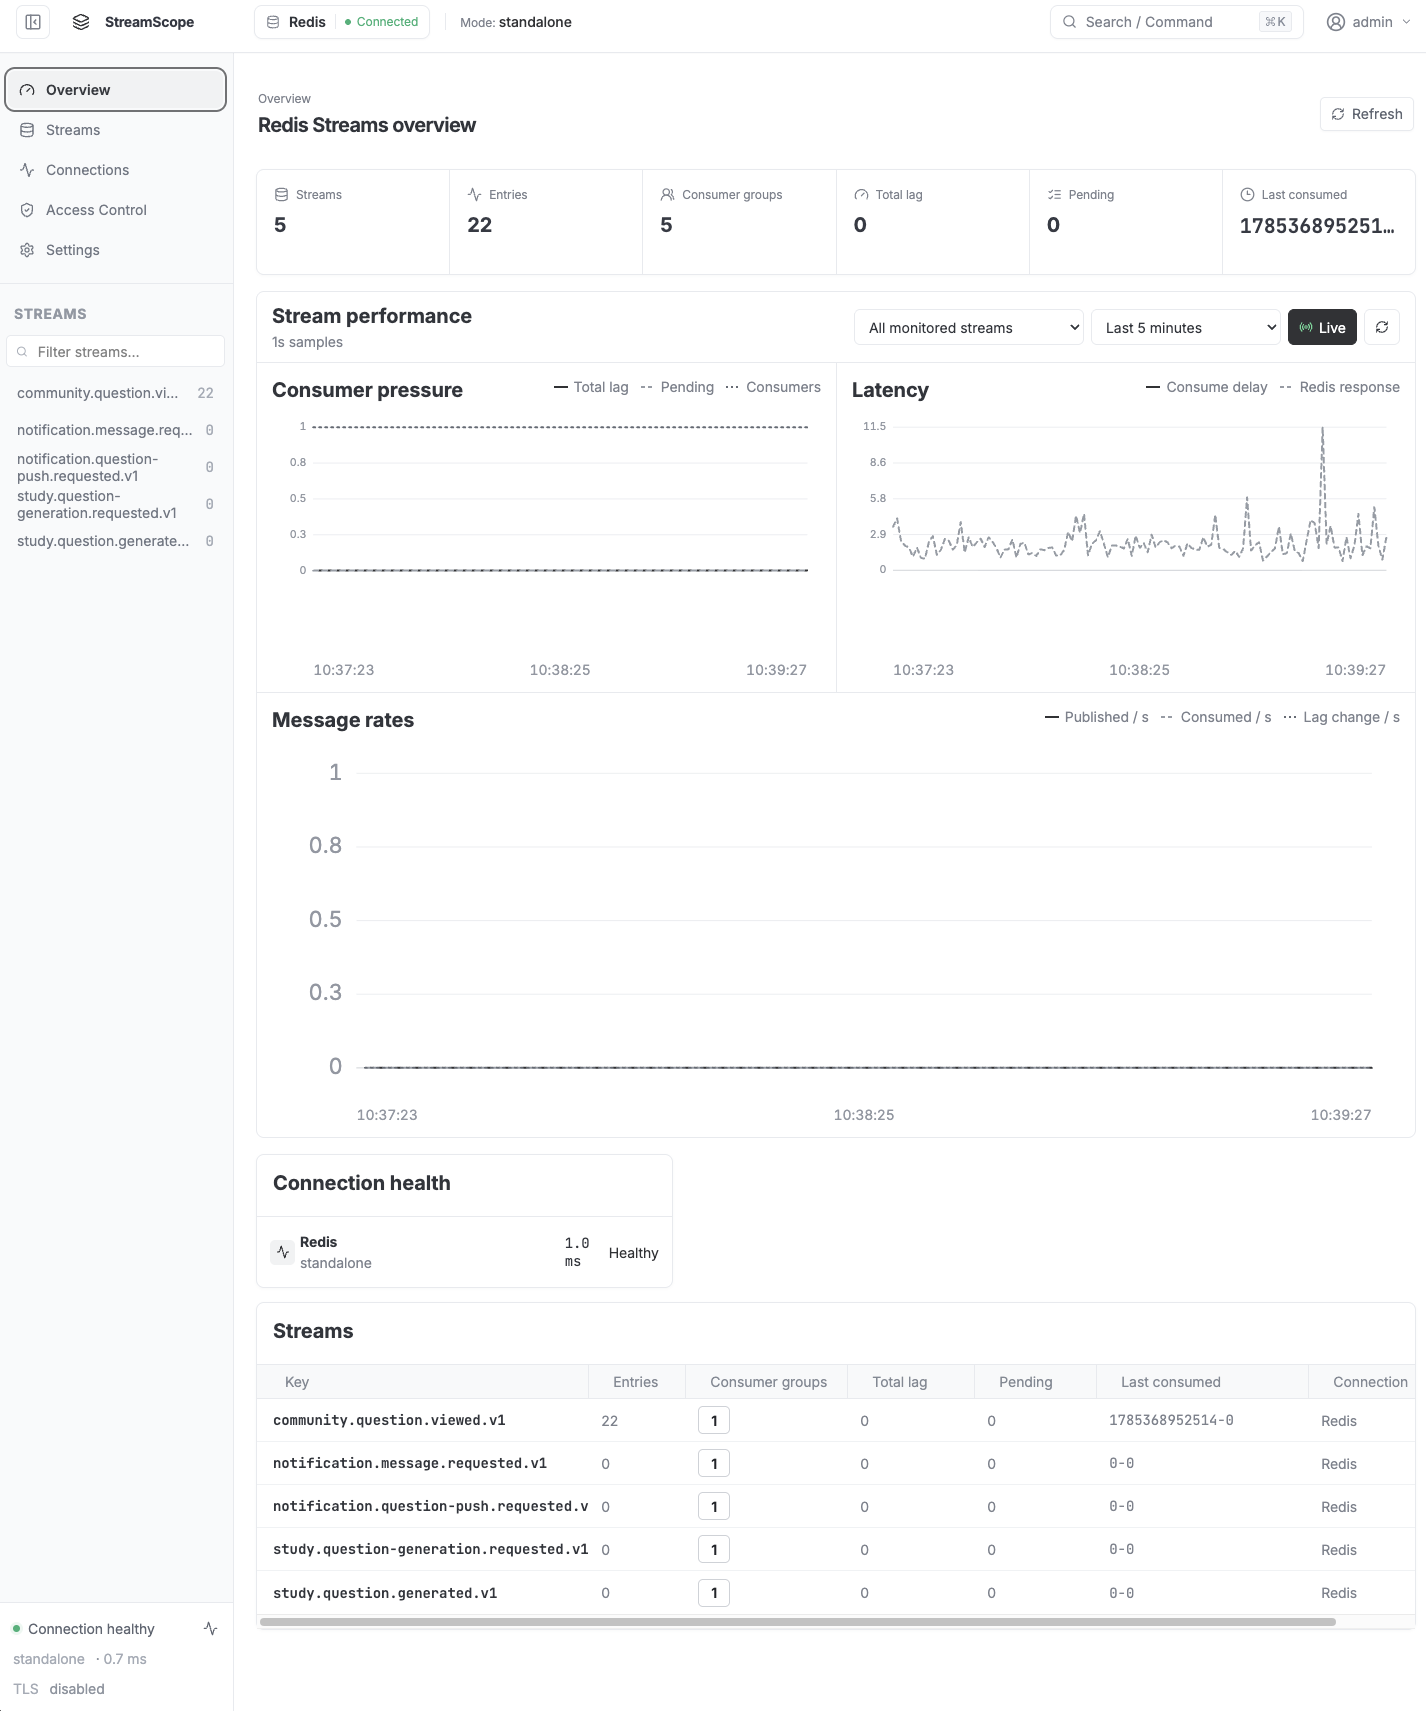
Track lag, pending work, consumption delay, Redis latency, and message rates with one-second live charts.
04
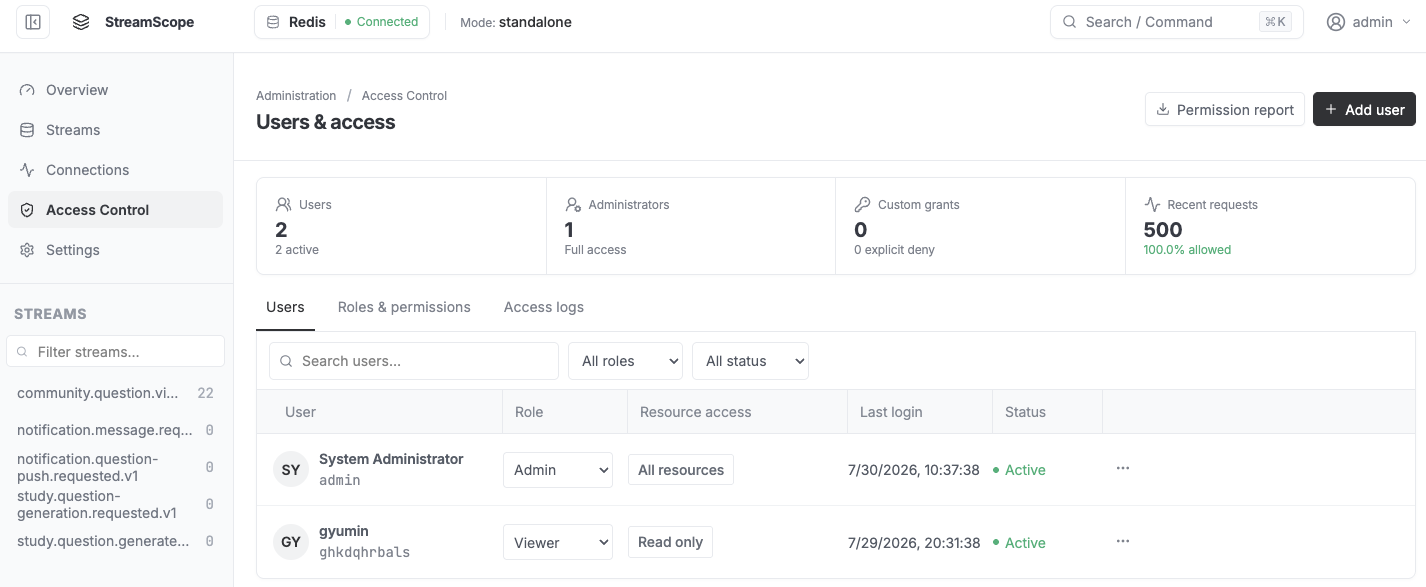
Manage users, roles, detailed permissions, Redis connections, and access history.
05
Preview consumer recovery operations, quarantine problem entries, and replay them safely.
06
Review consumer changes, topology and failover events, capacity forecasts, and retention expectations.
07
Route alerts to multiple webhooks with silences, maintenance windows, and escalation policies.
Quick start
Docker
admin / password
Helm without Ingress
kubectl --namespace redisstreamscope port-forward service/redisstreamscope 8080:80
Helm initial password
helm get notes redisstreamscope --namespace redisstreamscope
Helm requires a new administrator password after the first sign-in.
Open Settings → Redis connections. Add your server, test it, and save. Standalone, Sentinel, Cluster, ACL, passwords, and TLS are all supported.