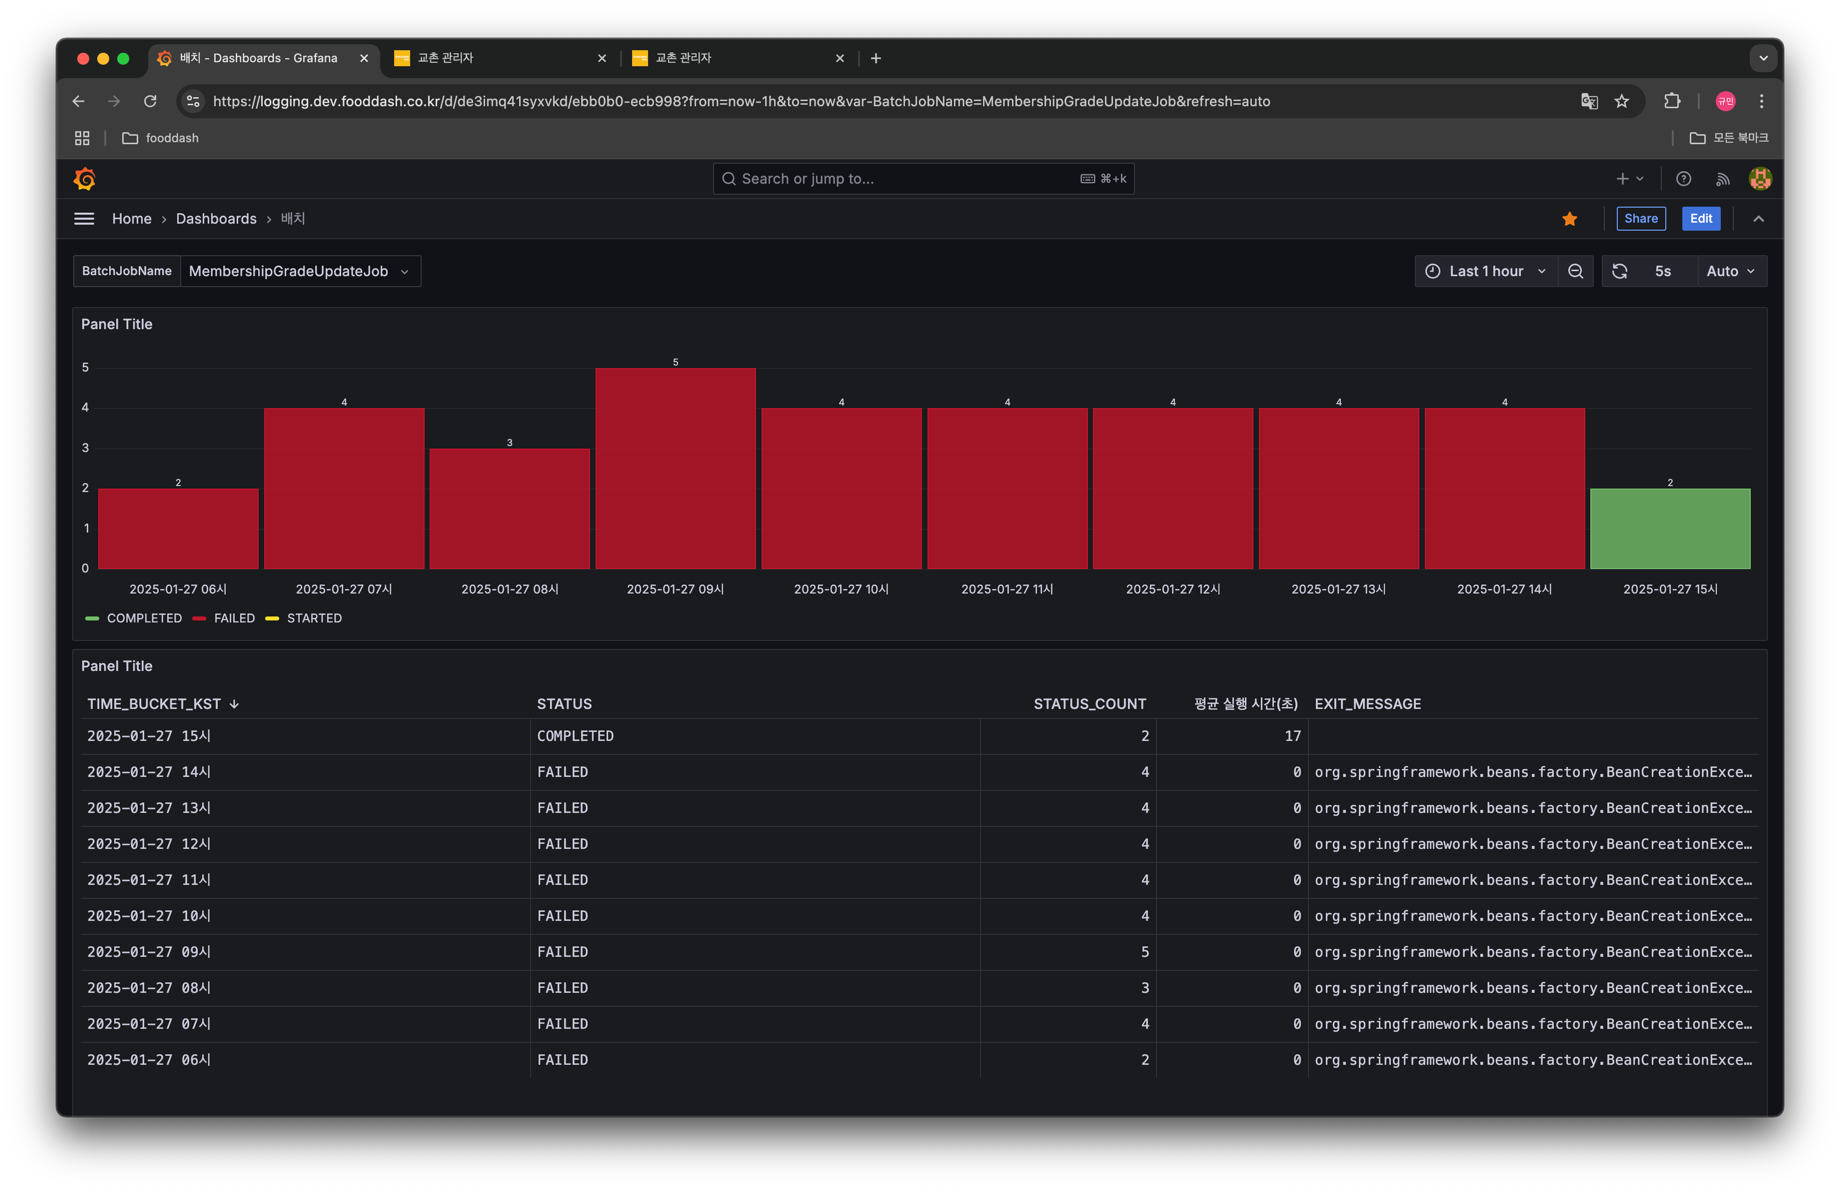
만들어두고 오랜만에 들어가봤더니 에러가 발생하고있었음. 그래서 에러메세지 확인 후 수정. 이거 에러발생 시 알림오도록 하는게 좋을듯?
이제는 노티가 너무 많아져서 알림관리도 필요할 듯!
또한 현재 job repository db 바라보고있어서 db 연결 이전 런타임 시 에러날 때를 캐치못하고 있는 문제가 있을 수 있음. db 가 아닌 다른 방법으로 모니터링하는 방법이 필요한 것 같음.
그러기 위해서는 promethus 가 필요하다는데 전체 로직이 어떻게 돌아가는지 파악하고 적용해야할 듯.그래서 한번 알아봄.
- cronjob, pod, deployment, … 등등 k8s 에서 여러 작업들의 상태를 etcd 에 저장함.
- etcd? : k8s 의 모든 정보를 저장하는 key-value 저장소(cronjob 상태값, …). 간단하게 보면 리눅스의
/etc+ distributed =/etcd. 그래서 Elastic Search, Kafka 처럼 분산 replica 시키면서 리더 선출하는 방식이 비슷함.
- etcd? : k8s 의 모든 정보를 저장하는 key-value 저장소(cronjob 상태값, …). 간단하게 보면 리눅스의
https://tech.kakao.com/posts/484 읽는 중 ing
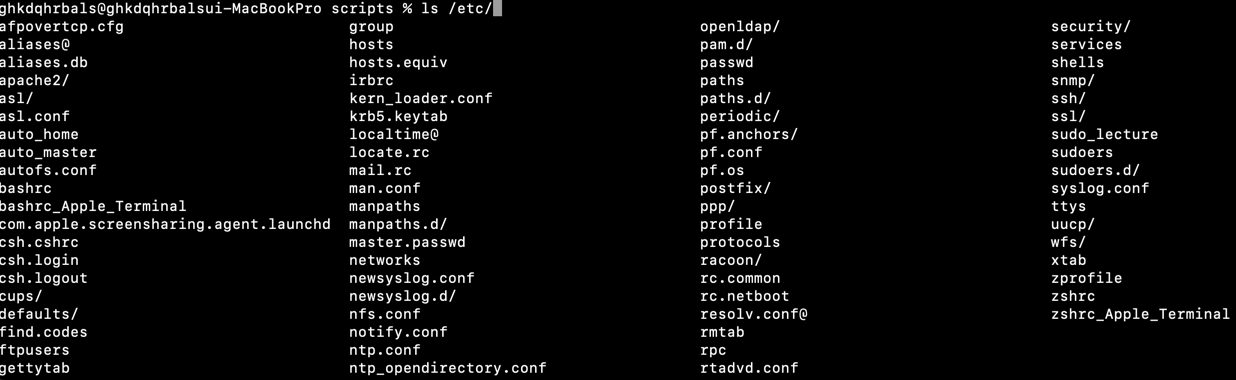
리눅스 /etc 가 가지고 있는 애들
I checked something I had made after a long time and found that an error was occurring. So I checked the error message and fixed it. It would be good to receive a notification when an error occurs.
Now there are too many notifications, so notification management may also be needed.
Also, since the current setup looks at the job repository DB, there may be a problem where errors that occur at runtime before DB connection cannot be caught. It seems like another monitoring method, not based on the DB, is needed.
For that, Prometheus is apparently needed, so I should understand how the whole logic works and then apply it. So I looked into it.
- In Kubernetes, the states of various workloads such as cronjobs, pods, and deployments are stored in etcd.
- etcd: a key-value store that stores all Kubernetes information, such as cronjob state values. Simply put, it is Linux
/etc+ distributed =/etcd. So the way it replicates and elects a leader is similar to ElasticSearch or Kafka.
- etcd: a key-value store that stores all Kubernetes information, such as cronjob state values. Simply put, it is Linux
Reading https://tech.kakao.com/posts/484 in progress.
Things Linux
/etchas